Managers-Net
Case Study
Uncovering unprofitable products and customers
A brewery had annual sales of approximately £50 million and was suffering long term decline.
The company had around 1,000 people in the brewery, warehouse and managed estate.
They also had tenanted pubs. Their wholesale wines and spirits division, which accounted
for sales of around £10 million, operated in a highly competitive market.
Although margins overall were shrinking, management suspected that some parts of the
business were performing worse than others. But the gross margins of the different product
groups and customer segments, as reported in the management accounts, and used as their
key performance measure, all looked fine. Managers suspected that gross margins had
become an inadequate measure of profitability, masking hidden costs. The company needed
to understand its net margins - for all its products, for all its customers.
The objectives of the project were to create an ABM model of net product and customer profitability,
train the company's staff in the principles and techniques of ABM and in model-building,
and to draw conclusions from the results.
Results
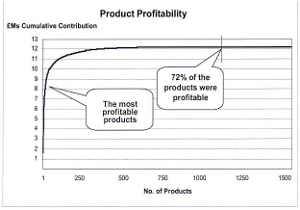 For each product, the contribution to profits
was calculated by subtracting from
its revenue all costs that supported it or that
were driven by it. The results were presented
graphically (as shown right) by sequencing
the products by size of contribution, biggest
on the left, and plotting the cumulative
contribution of them all. Although a number
of products were highly profitable, about
40% of them provided close to zero
contribution - the flat part of the graph.
For each product, the contribution to profits
was calculated by subtracting from
its revenue all costs that supported it or that
were driven by it. The results were presented
graphically (as shown right) by sequencing
the products by size of contribution, biggest
on the left, and plotting the cumulative
contribution of them all. Although a number
of products were highly profitable, about
40% of them provided close to zero
contribution - the flat part of the graph.
The last 28% were marginally losing money.
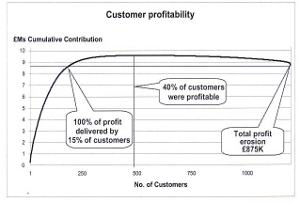 A similar exercise was carried out for each
customer.
A similar exercise was carried out for each
customer.
The result was a shock:
Only around 40% of their customers
were profitable.
The rest were losing
the company £875K.
100% of the profit delivered by only 15% of the customers
For example:
Further analyses showed up other interesting
results, some of which were a real surprise.
- 20% of the customers of the wholesale
business were profitable, contributing £300k.
Unfortunately the others pulled profitability
down to an overall loss of £100k. The only
viable option was to withdraw from certain
geographic regions because little could
be done to bring costs down to the levels
needed to turn this part of the business
round.
- 50% of the free trade made a healthy profit,
mainly because the product mix was
predominately 'draught'. Where the mix was
mainly 'bottled' this segment lost money.
- All tenanted and managed houses were
profitable, which was reassuring.
- Only 50% of the Take home/National business
was profitable. This segment needed working
on to build up gross margins.
The analyses in the model, showed management
where specific actions would lead to healthy
gains in profitability in the short to medium
term. Further refinement of the model then
delivered many pointers to subtle changes
in the business that helped it continue to build
a growing and robust bottom line.
Why did the project make such a difference to business performance?
This approach made all the difference. It uncovered where profits were being made or lost.
It showed the underlying reasons for losing money and what we needed to do to turn unprofitable business around.
And it gave management the confidence to drop whole segments of unprofitable business when there was no hope
of turning it to profit.
The company needed to understand its net margins for all its products and for all its customers.


browser implementation
For more information, contact: Managers-Net.

