Accurate Operations Costing
Despite all the talk of strategic initiatives the Utility Company depended for success on doing the basics well. Responsibility for delivery lay at the door of the operations managers in the Distribution Division.
The Operations Managers running the installation, maintenance and repair teams typically had a good idea what was happening on the ground. They had to. But they didn't have time for painstaking fact-finding and analysis, so they didn't have valid, up to-the-minute information on performance. Their ability to spot emerging problems, and then get to the heart of the problem quickly, was often restricted.
Equally, because they hadn't got the full costs of doing jobs, they often had to rely on intuition and gut feel to choose the least expensive way. But the hidden costs of planning, inspection, possession, diversions, reinstatement or overtime often broke the budget or made the difference between profit and loss.
The requirement
The data needed was almost certainly there. But it was split across different systems and the tools for converting it into useful information were inadequate. The Operations Managers, and the organisation, were flying blind.
The need was for an information tool that pulled together relevant data from disparate systems, and from distant parts of the same system, to provide a clear picture of the operation. Using simple technology, managers had to be able to compare variables that affected cost or performance, such as different teams, regions or assets, different types of labour or plant, or different periods, and be able to delve into the detail where the devil was often hiding.
In addition, the tool had to improve the accuracy of costings by attributing indirect resources - such as Planners, Schedulers and Management - on the basis of actual usage, rather than through distorting averages. It also had to show whether the Division was achieving its goals within budget and be able to predict the resources required to meet forecast changes in business volumes.
Additionally, it also had to report the true contribution that contracts made to non-operational overheads.
The tool: ‘Ops-Coster’

Because the tool was an amalgam of the outputs from the ABC analysis and other systems the managers came up with an overall name. The tool was simply dubbed ‘Ops-Coster’.
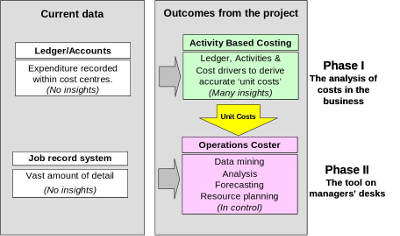
Ops-Coster was a combination of data, lots of it, from a current system – job recording – and the analysis of costs, particularly overheads, using an Activity Based Costing model.
Costs could now be combined with the myriad of types of jobs that were undertaken by all the staff and contractors in the whole of the Distribution Division. The data was combined as shown in the diagram (right).
Phase I was the basic cost analysis in the ABC model. Phase II brought the data together in Ops-Coster which was designed so that relevant and useful information came on managers’ desks so they could make better decisions.
The beauty of the tool was its ability to slice and dice data and then let managers delve deeper into specific areas of interest or concern.
The true value came from being able to answer questions that were completely relevant to the Operations Managers rather than those questions that the standard systems could answer that were mostly designed for the finance department.

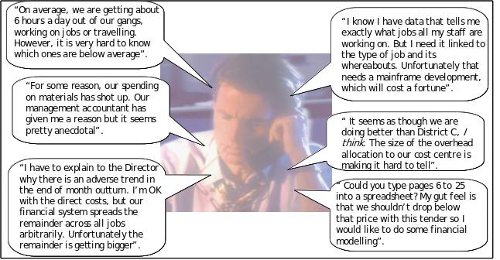
Operations Managers used to be frustrated by the standard systems’ inadequacies at being unable to deal with the many daily concerns. Some typical concerns are shown here (right). Ops-Coster was designed to handle all these types of questions with ease.
“an information tool that pulled together relevant data from disparate systems, and from distant parts of the same system, to provide a clear picture of the operation”
From humble beginnings
With the bit between their teeth Operations Managers then saw many opportunities to extend the tool in their own functions. And when the Commercial Division saw what was possible they set down plans to add to the tool so it delivered both services and customer profitability information.
- 1. Performance Analysis
- Provides a range of metrics reflecting the utilisation and effectiveness of front line, support, and management teams.
- 2. Capacity Planner
- Gives managers a realistic figure for the spare capacity inherent in front line and support teams.
- 3. Scenario Planner
- Costs individual services accurately, based on forecast volumes of work and associated capacity needs. Also suggests service prices based on costs that can be set to full or marginal, as required.
- 4. Profit Analysis
- Calculates the profit contribution made from services to the consumer and to other businesses. It also calculates the profit contribution made from each customer.


The ABC model determined a vital piece of new information for the Division: ‘Unit Costs’.