Determining the profitability of courses and students
A university offered a wide and flexible choice of courses with a variety of modes of study catering for a diverse student population. It focused on providing for the needs of the local region and had a high proportion of mature and part time students.
The university had suffered from reducing student numbers as a result of changes in the market place. Competition for students had become increasingly fierce and other universities were rapidly catching up as the sector became more commercial in its approach.
Following a review that identified many opportunities to reduce costs, a key requirement was a need to refine the university’s offer (its courses) and to whom it made the offer (its students). To get greater transparency of where costs actually went and, when compared to revenue, how much the courses made from various types of students, the university decided to create an Activity Based Costing Model of the whole organisation.
The scope of the model
- Total costs of the university were £70 million of which £40m went on modules (£35m) and students (£5m).
- The total number of students was 13,000 along with 630 academic staff and 690 support staff.
- There were 2,000 modules which went into 1,000 courses.
- Students could have 3,500 degree combinations.
Schools recruited their ‘own’ students and provided some welfare services. Schools developed and delivered their own modules although and students from other schools could also select them. For example a law student might also select various language modules.
There were many combinations of types of study such as full or part time, on campus or distance learning, sources of funds, type of student accommodation provided and so forth.
All these attributes provided different levels of costs for each student. A typical school had high costs creating and delivering modules but relatively low ‘welfare’ costs associated with students. The reverse applied for central support functions.
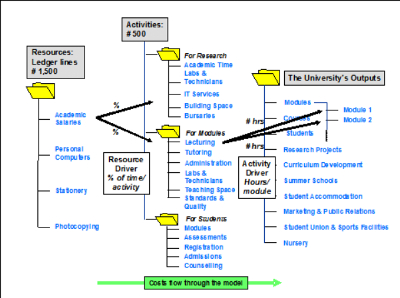
- The model’s construction started with the resources, which are found on the ledger.
- Activities were found by interviewing people throughout the university.
- The range of outputs that the university delivers was also agreed.
- Resources were then assigned to activities using suitable drivers. Similarly, costed activities were assigned to the outputs.
In particular the university was interested in the costs of modules and the costs of students.
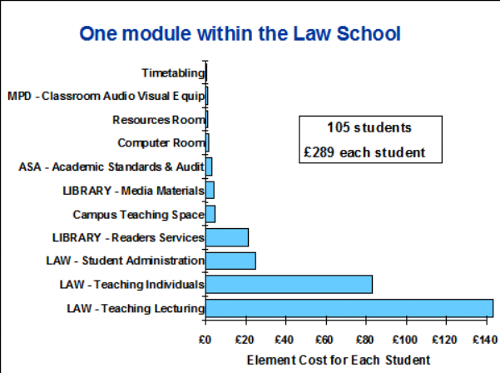

Illustrated right are two of the analyses.
The first shows the costs that make up one of the modules in one of the schools.
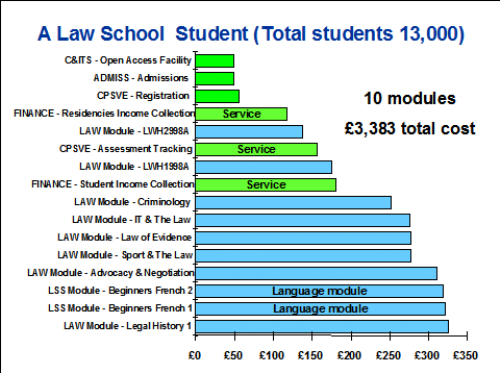
The second shows how student costs were built up.
Combining module and student cost data provided many insights into the university’s costs and profitability. For example, the cost of typical law students based on the service costs they needed and the modules they selected could be compared to income. (see below)
Other analyses uncovered low revenue students (eg from the ‘Education School’) choosing a range of modules that were developed and delivered by other expensive schools. This ‘unprofitable’ situation hadn’t been fully appreciated in the past.
Also a module that attracted less than 15 students leapt in cost per student raising the issue of whether that module should be run at all. Previously, any module that came into existence seemed to have an infinite lifespan!


The Activity Based Costing model provided essential management information on processes, resources, ‘products’ and ‘customers’: