Improving profitability of a supermarket chain
A supermarket chain had a number of Regional Distribution Centres serving several hundred branches.
Although the gross and net margin of the overall business was acceptable, the business wanted information that couldn’t be derived from the conventional accounts or any other available management data:
- More refined distribution costs so it could negotiate more vigorously with its 3rd party distributor, who handled around 40% of the volume
- A model of the ‘selling operation’ in order to determine the net profit at category level in the stores (160 categories)
- The ability to simulate different distribution and selling configurations so it could evaluate their relative benefits
To provide the answers, an Activity Based Costing (ABC) model was created. The result, after three months, identified opportunities to increase the current overall net margin by 17% - many millions of pounds.
Distribution
The Distribution division worked on a simple cost-per-case measure for each of the major types of goods (ambient, chilled, frozen). This gave the business a ‘back-of-store’ gross margin. The first stage of the ABC project refined this figure by considering the actual packaging and handling characteristics of every product in the distribution part of the supply chain. The model of the Distribution division provided an accurate cost of getting products to the stores. This data was also used to challenge 3rd party prices because the contractor’s business could now be simulated using the ABC model.
Stores

Many costs were incurred between the back of the store and the checkout. Each cost type was considered for each product and category so that the amount of erosion of gross margin could be derived. The project team identified the in-store activities, space and equipment costs for each product. This created a whole series of unit costs such as replenishing each type of product on display, opening & closing the delicatessen, doing stock audits, per item and per customer checkout activities, and so forth.
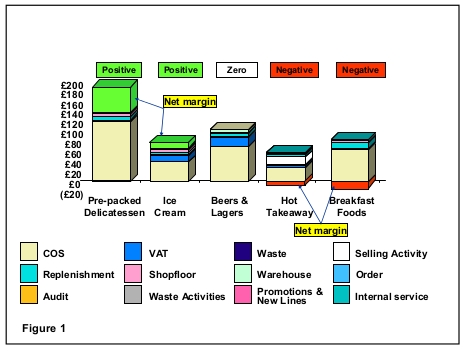
Each product category had its own characteristic set of activities and activity frequencies. Using the unit cost data, the ABC model calculated the costs of each category and subtracted them from the gross margin. This revealed the net margin of each category.
Figure 1 shows that some categories enjoyed a high net margin while others proved negative.
Digging deeper

Where sales per base linear metre are high, it is not unreasonable to assume that those products will always have a positive net margin.
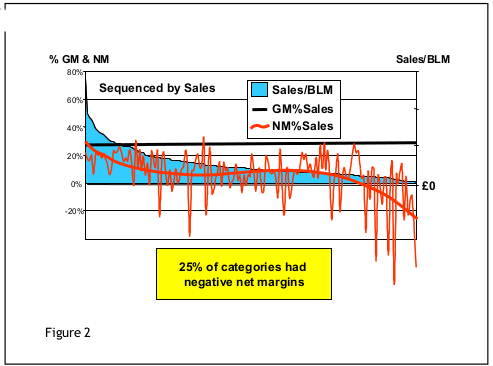
However, deeper digging revealed that, whereas gross margins were fairly stable across all products in all categories, the net margins varied wildly.
As we see in figure 2, for around 80% of the categories the net margin could be positive or negative. This worrying feature is common to all retail operations and has led to the general observation that:
Gross margin is not a good predictor of net margin.
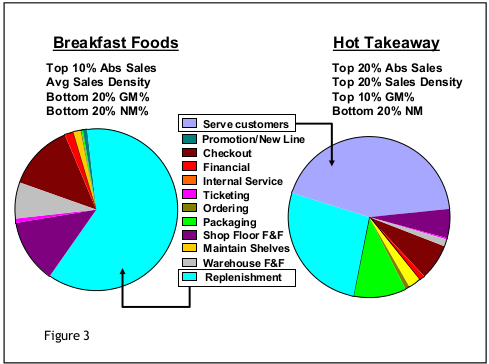
The ABM model held all the activity data so each product category could be analysed to uncover the reasons for the gross margin erosion. The largest costs revealed most of the problems, as illustrated in figure 3.

Replenishing breakfast foods with anything less than a full case meant returning product to the back of the store, enough to make this category unprofitable. Hot Takeaway required staff to be available to serve customers even during slack periods.
Armed with the reasons for poor net margin performance, managers began looking at ways to improve things. In some cases, working processes were altered, in others pricing was changed.
In some instances, where a category was making a large loss from low sales, the space was used for other products and categories. However, these actions always had to be tempered by considering a typical ‘basket’ of products purchased by customers, because loss making products may be offset by very high net margin products regularly purchased in combination.
The result of all management’s plans and actions that came from the activity-based analyses was a dramatic increase in overall net margins.


Key benefits
The case study illustrates the key benefits of using the ABC analysis and modelling approach.